Fall Semester Regents Earth Science
John Dewey High School
Mr. Klimetz
Coding and Decoding Ground Atmospheric Pressure Readings
An Exercise in the Coding and Decoding of Ground-Based Atmosopheric Pressure Data
Atmospheric [barometric] pressure readings appear as measurements, in millibars [mb], with four or five digits with a decimal point between the last and next-to-last digit. Such lengthy numbers occupy considerable space when plotted on a synoptic air pressure data map. Hence, such numbers can be difficult to read, distinguish, and decipher, particularly if there is much data acquired from a limited geographic area. Meterologists have developed a coding system for reducing the quantity of numbers in a pressure reading in order conserve space when plotted on a map and provide for more accurate reading and interpretation.
Coding. The following explains how barometric pressures are coded on a weather map.
Example 1: 1013.7 mb
Example 2: 989.6 mb
b. 896
Code the following:
Meteorologists code the pressures that they report on their weather maps and on their weather station models to save space and improve the ease of reading.
Decoding. The following explains how barometric pressures are decoded when reading a weather map:
Example 1: 146
a. Replace the decimal point between the last two digits, ex. 14.6
Example 2: 972 equals which of the following true pressure values?
a. 97.2 b. 997.2 c. 1097.2
Ans: 997.2
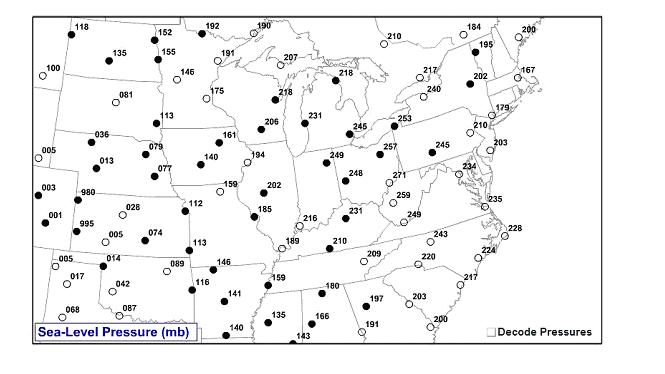
I. The map on the following page shows coded pressure data reported from weather stations in the eastern half of the United States whose locations are indicated by the open and closed circles. Based upon the information presented above, decode the pressure readings from the weather stations. You should print the decoded reading below each circle in pencil. Once you have completed fully decoding the pressure data, sketch in isobars with a 4 mb interval beginning with 998.0 mb
II. Uncoded pressure data reported from weather stations is listed below. Based upon the information presented above, code each of the pressure readings and write on the line adjacent to the uncoded readings.
1022.5 mb _____________
997.4 mb ______________
1003.9 mb _____________
977.2 mb ______________
1021.4 mb _____________
969.8 mb ______________
981.4 mb ______________
1039.1 mb _____________
1023.0 mb _____________
1001.1 mb _____________