Fall Semester Regents Earth Science
John Dewey High School
Mr. Klimetz
Construction and Interpretation of Isotherm Maps II
An Exercise in the Graphical Processing and Visual
Interpretation of Ground-Based Temperature Data
The construction and interpretation of isotherm maps by the meteorologist is an integral part of the process of weather prediction. An isotherm is an imaginary line on a geographic base map that connects points of equal ground air temperature. An isotherm map distinguishes regions on the basis of the air temperature and is an important tool in weather forecasting. The isotherm is the graphical equivalent of the topographic contour, excepting the data being contoured is ground air temperature as opposed to ground elevation. Based upon your understanding of contouring of numerical data, prepare an isotherm map of the synoptic ground air data of the conterminous United States shown below using a contour interval of 10 degrees F.
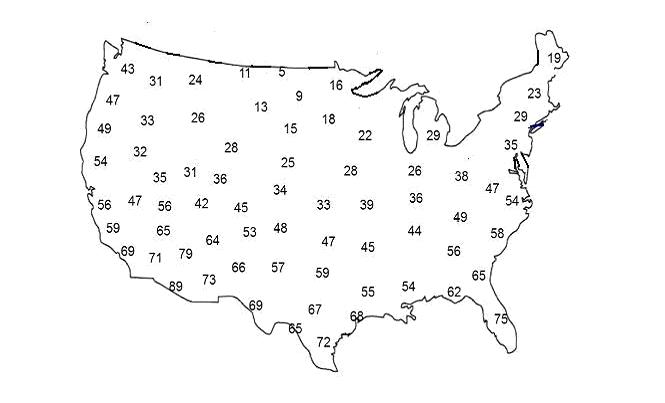
Ground Air Temperature