Fall Semester Regents Earth Science
John Dewey High School
Mr. Klimetz
Contouring Topographic Field Data
Topographic maps add a third dimension to latitude and longitude by showing natural (and cultural) features of the earth’s surface — in particular, elevation. Historically, mapmakers used a variety of methods to indicate elevation. For simplicity, clarity, and accuracy, most topographic maps today use contour lines.
Contour Lines
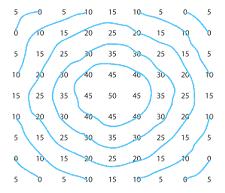
Contouring is the drawing of lines on a two-dimensional grid of numbers that connect points of equal value. In the following grid, for example, I’ve drawn contour lines connecting multiples of 10, so we’d say that the contour interval — the space between the lines is 10:
A grid of numbers with contour lines.
The contour interval is 10.
Class Task
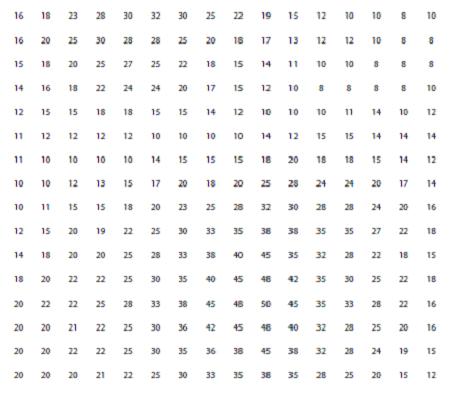
Construct a contour map in the grid with a contour interval of 10 on the map grid below in pencil. That is, contour starting with zero, then 10, 20, etc., until the maximum multiple of ten has been contoured. Which topographic features seem to appear based upon the pattern of your contours?