The Construction and Interpretation of Isotherm, Isobar
and Weather Station Model Maps
Aims:
How do we construct and interpret a weather station model?
How do we construct and interpret an isotherm map?
How do we construct and interpret an isobar map?
How do isotherm, isobar, and weather station model maps reveal the interrelationships between weather variables?
How do weather maps allow meteorologists to predict weather?
Student Objectives:
Students should be able to
obtain current New York State weather data from selected Internet sources;
create an accurate isotherm map of New York State;
create an accurate isobar map of New York State;
create a Reference Tables standardized weather station model;
create a weather station model map of New York State;
interpret an isotherm map and identify the character and location of a weather front;
interpret an isobar map and identify the location and pattern of wind circulation reflective of high- and low-pressure
air masses; and
interpret the weather station model map to explain the current and to estimate the near future weather conditions
throughout New York State.
Introduction. A basic observation in the earth sciences is that energy is constantly bringing about changes. Since energy is defined as the ability to do work, then work can be thought of as the response (or displacement) of matter to the addition (or withdrawal) of energy. The changes in the Earth's environment such as weather, therefore, constitute the work done in response to, and as a necessary outcome of, the vast amount of energy made available from insolation. In order to understand the constantly changing Earth, we must clearly conceptualize the energy systems at play within the environment which cause those changes.
The study of energy interactions within the atmosphere leads to the identification of systems that can be mapped as field quantities. That is, their characteristics can be plotted both spatially and temporally in the form of a map on a geographic base. A series of single or composite maps showing these selected atmospheric variables provide a picture of past and present weather conditions over a selected region. Such maps are called "synoptic" maps because they represent instantaneous "snapshot" views of simultaneous weather variables over a specific area. By analyzing the spatial and temporal distribution and variation of weather variables, meteorologists are able to predict the movement of weather systems and air masses. The practice of weather forecasting, therefore, is based on, and dependent upon, the accurate plotting and interpretation of synoptic weather variable maps.
field gradient: ________________________________________________
Materials:
Meteorological Reading/Observations Sheet from the National Weather Service
Isobar Map of New York State plotting sheet
Isotherm Map of New York State plotting sheet
Weather Station Model Map of New York State plotting sheet
Wind Speed Equivalents table
Procedure:
A. Construction of an Isotherm Map:
1. Transfer all the temperature values from the locations listed on the Meteorological Readings/Observations Sheet on to the same locations indicated on the isotherm plotting sheet.
2. Sketch the isotherms on the plotting sheet using an interval of 5 degrees F following the same techniques employed in the construction of a topographic contour map. (Your lowest isotherm will have a value of 40 degrees and the next highest will be 45 degrees.)
3. Label each isotherm with its appropriate temperature value.
4. After you have completed your isotherm map, plot the most likely location of a weather front with a black pencil line. The front will be located where the temperature field gradient is highest. That is, the isotherms will be very closely spaced.
5. Shade-in the map area experiencing warm air (that is, the area on the side of the front where the air temperatures are relatively high) in red.
6. Shade-in the map area experiencing cold air (that is, the area on the side of the front where the air temperatures are relatively low) in blue.
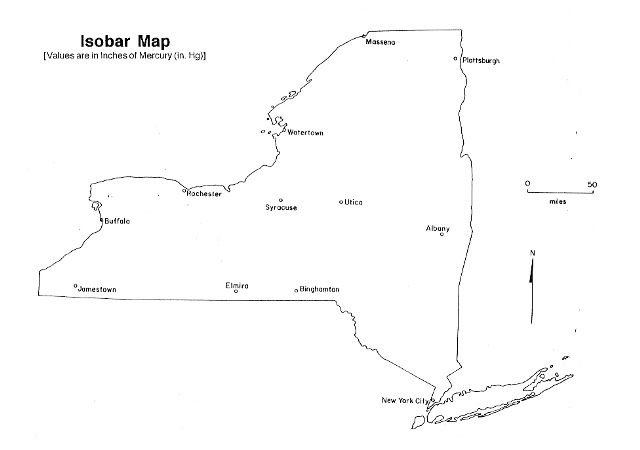
B. Construction of an Isobar Map:
1. Transfer all barometric (air) pressure reading from the locations listed on the Meteorological Readings/Observations sheet on to the same locations indicated on the isobar plotting sheet.
2. Sketch the isobars on the plotting sheet using an interval of 4 millibar (mbar). (Your lowest isobar will have a value of 1006.0 millibars and your next highest isobar will have a value of 1010.0 millibars.)
3. Label each isobar with its appropriate pressure value.
4. After you have completed your isobar map, plot the most likely location of a weather front with a black pencil line. The front will be located where the air pressure field gradient is highest. That is, the isobars will be very closely spaced.
5. Shade-in the map area sitting under relatively low pressure air (that is, the area on the side of the front where the air pressures are comparatively low) in red.
6. Shade-in the map area sitting under relatively high pressure air (that is, the area on the side of the front where the air pressures are comparatively high.)
7. Sketch-in arrows at each station to represent weather vectors (that is, the direction in which the wind is traveling) at each location.
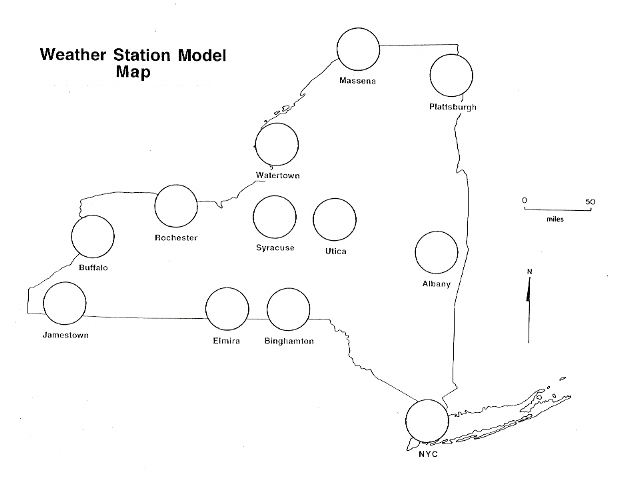
C. Construction of a Weather Station Model Map:
1. Consult the Meteorological Readings/Observations sheet.
2. Transfer the appropriate weather variables from the observations sheet to the station model format, as per the standard model provided, at each location.
3. Your completed models should contain variable such as air temperature, air pressure, wind direction and speed, cloud cover, precipitation, dewpoint temperature, barometric trend, and present conditions. (Note that visibility data is not provided.)
Discussion Questions.
1. According to your isotherm map, list which locations in New York State are
a. experiencing the warmest temperatures,
b. experiencing the coldest temperatures, and
c. located at the boundary between the cool and warm air masses.
a. __________________________________________________________
b. __________________________________________________________
c. __________________________________________________________
2. According to your isobar map, list which locations in New York State are experiencing
a. the lowest air pressure, and
b. the highest air pressure.
a. __________________________________________________________
b. __________________________________________________________
3. According to your isotherm and isobar maps, explain the observed relationship between air temperature and air pressure at any given location.